Source: Phillip Capital
Source: Phillip Capital
Source: Mint
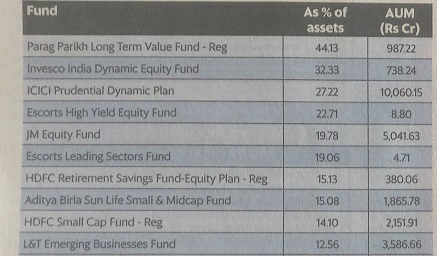
Data as on 31 Dec,2017

Some stuff I am reading today morning:
How new LTCG tax with STT violates basic principles of taxation (Uma Shashikant)
Alarm over Modi’s protectionism (Arvind Panagariya)
WhatsApp payment feature is a serious threat to PayTM (Mint)
Fortis seeks 15 days extension to declare results (MC)
US Equities-Recent volatility is not a concern (Vikas)
“Alpha” in real estate (PIB)
Getting India EV ready (Forbes)
Passive my a** (TRB)
Why competitive advantages die? (Morgan Housel)
This Mutual Fund crashed by 80% in 2 days (Barrons)
This post is in continuation of my coat tailing series (see here)
To know what other top investors are buying/holding/selling in India, subscribe to our Investor Wisdom Newsletter
Faering Capital is a well known PE firm run by Aditya Parekh, son of HDFC Chairman Deepak Parekh
Their significant holdings in the listed space as on 31 December,2017 as per stock exchanges is as given below:
| Company Name | NSE Symbol/BSE Code | Entity | Value (In Crores) |
| City Union Bank | CUB | FAERING CAPITAL INDIA EVOLVING FUND | 120.91 |
| HSIL Ltd | HSIL | FAERING CAPITAL INDIA EVOLVING FUND | 31.5 |
| Prataap Snacks Ltd | DIAMONDYD | FAERING CAPITAL INDIA EVOLVING FUND II | 58.53 |