Categories Chart Story of India Small Cap in 2 Charts Post author By Raoji Post date January 3, 2019 3 Comments on Story of India Small Cap in 2 Charts Source: Annual Report of JBM Auto Ltd 2017-18 Share this: Share on Facebook (Opens in new window) Facebook Share on LinkedIn (Opens in new window) LinkedIn Share on X (Opens in new window) X Share on WhatsApp (Opens in new window) WhatsApp Email a link to a friend (Opens in new window) Email Discover more from Alpha Ideas Subscribe to get the latest posts sent to your email. Type your email… Subscribe ← Where do Indians Invest? → Some Qs for Management 3 replies on “Story of India Small Cap in 2 Charts” EBITDA was more than market cap in FY14? Something seems amiss. Was common in 2014 Enteprise Value gives a better picture Leave a ReplyYour email address will not be published. Required fields are marked *Comment * Name * Email * Website Notify me of follow-up comments by email. Notify me of new posts by email. Δ
3 replies on “Story of India Small Cap in 2 Charts”
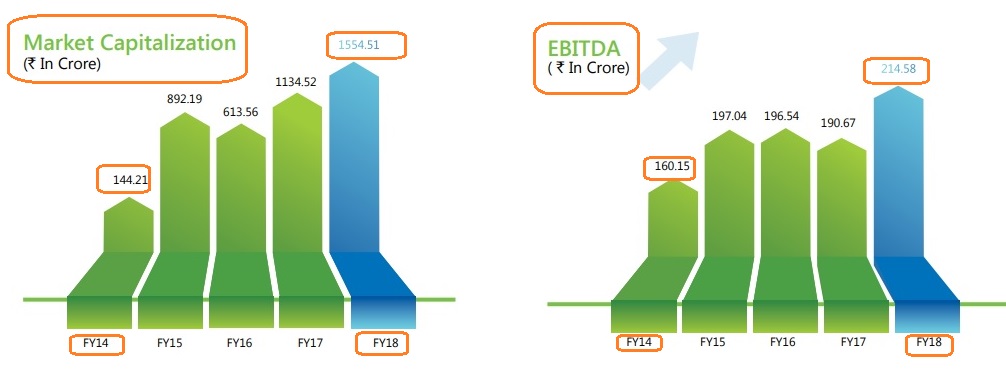
EBITDA was more than market cap in FY14? Something seems amiss.
Was common in 2014
Enteprise Value gives a better picture