Categories
Chart: FIIs Vs DIIs
Source: Bloomberg
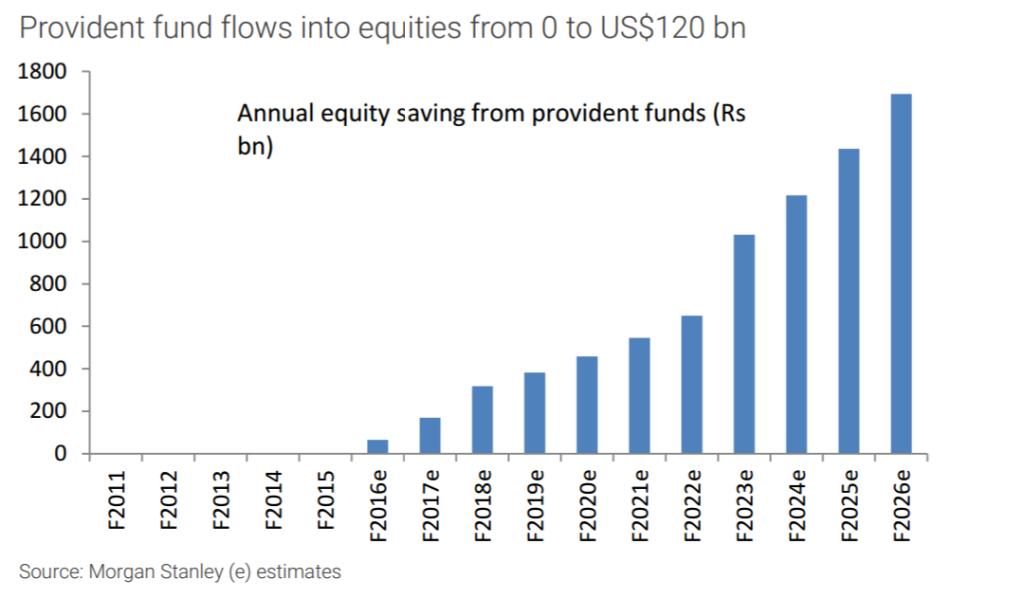
Source: Morgan Stanley Research
Provident Fund Flows into Equities has seen a 21% CAGR in the last 5 years and is expected to continue
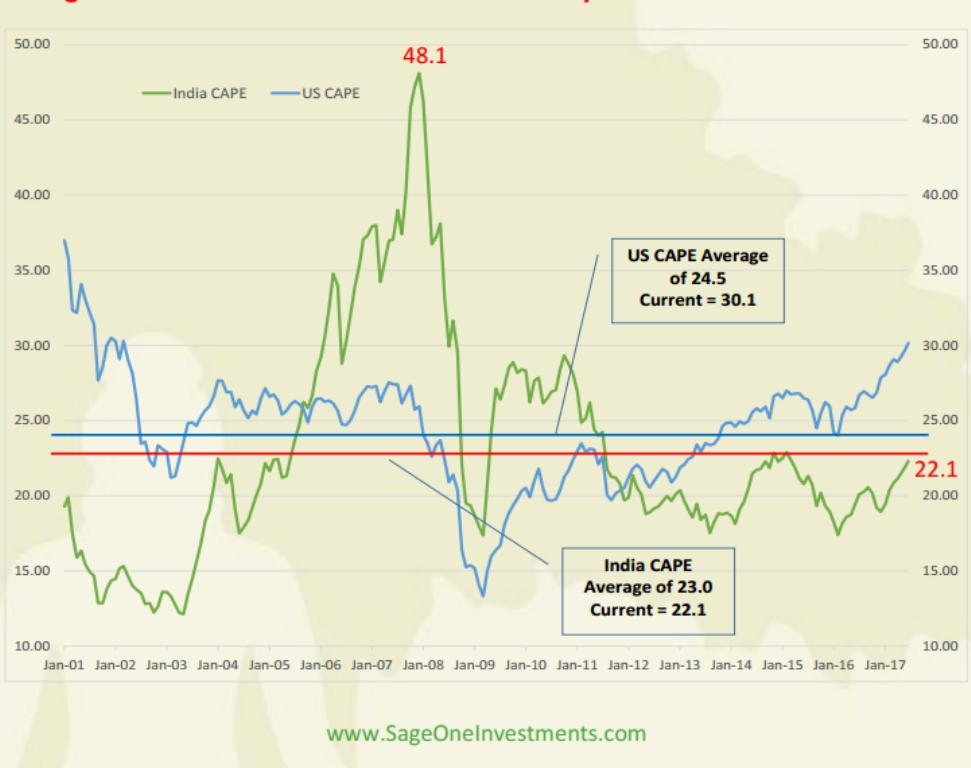
Source: Sage One Investments
Look at Cyclically Adjusted PE (CAPE) ratio which is developed by Professor Robert Shiller and is defined as price divided by the average of ten years of earnings (moving average), adjusted for inflation. This ratio addresses the issue of margin volatility during an economic cycle.
Please note that Sensex CAPE had reached a high of 48.1x in December 2007 and currently we are less than half of that level.